

6 insights to optimise your SAP Extended Warehouse Management
To optimise complex warehouse management processes, you need clear, actionable insight into each step.
If you know exactly where and how there is room for improvement at any given moment, you can painlessly adjust your processes to match the changing circumstances, ensuring they are always as efficient as possible.
Use standard KPIs, or create your own to fit your business
Standard Analytical FIORI Applications provided by SAP in S/4 HANA, (for example, Warehouse KPIs – Operations) can be used.
Bespoke Analytical FIORI Applications can also be created using the ABAP CDS Views data source, to perfectly fit your business goals and requirements. Useful KPIs can be configured through SAP Smart Business based on these CDS views and the KPIs can be assigned to related end users. Drill-down options can also be provided to navigate to the underline documents.
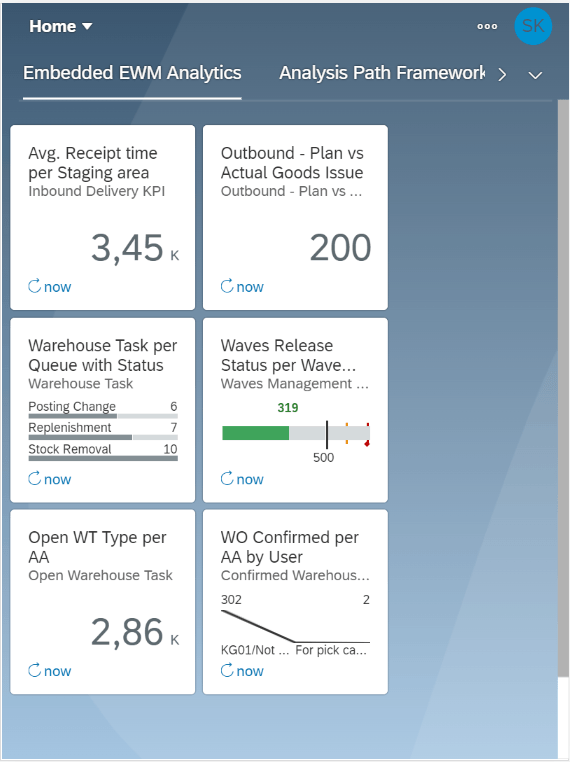
6 insights you can gain from Embedded Analytics in SAP EWM
There are countless ways you can use Embedded Analytics to gain insights into your warehouse management processes. Here are 6 examples of how the analytics can be used to make your processes more efficient and cost-effective.
1: Deliver goods efficiently
Gain insights on Outbound delivery orders by seeing their Goods Issue status.
We can see the number of Outbound delivery orders with Goods Issue status “Completed”, and the number of Outbound delivery orders with Goods Issue status as “Not Started”, on a daily basis.
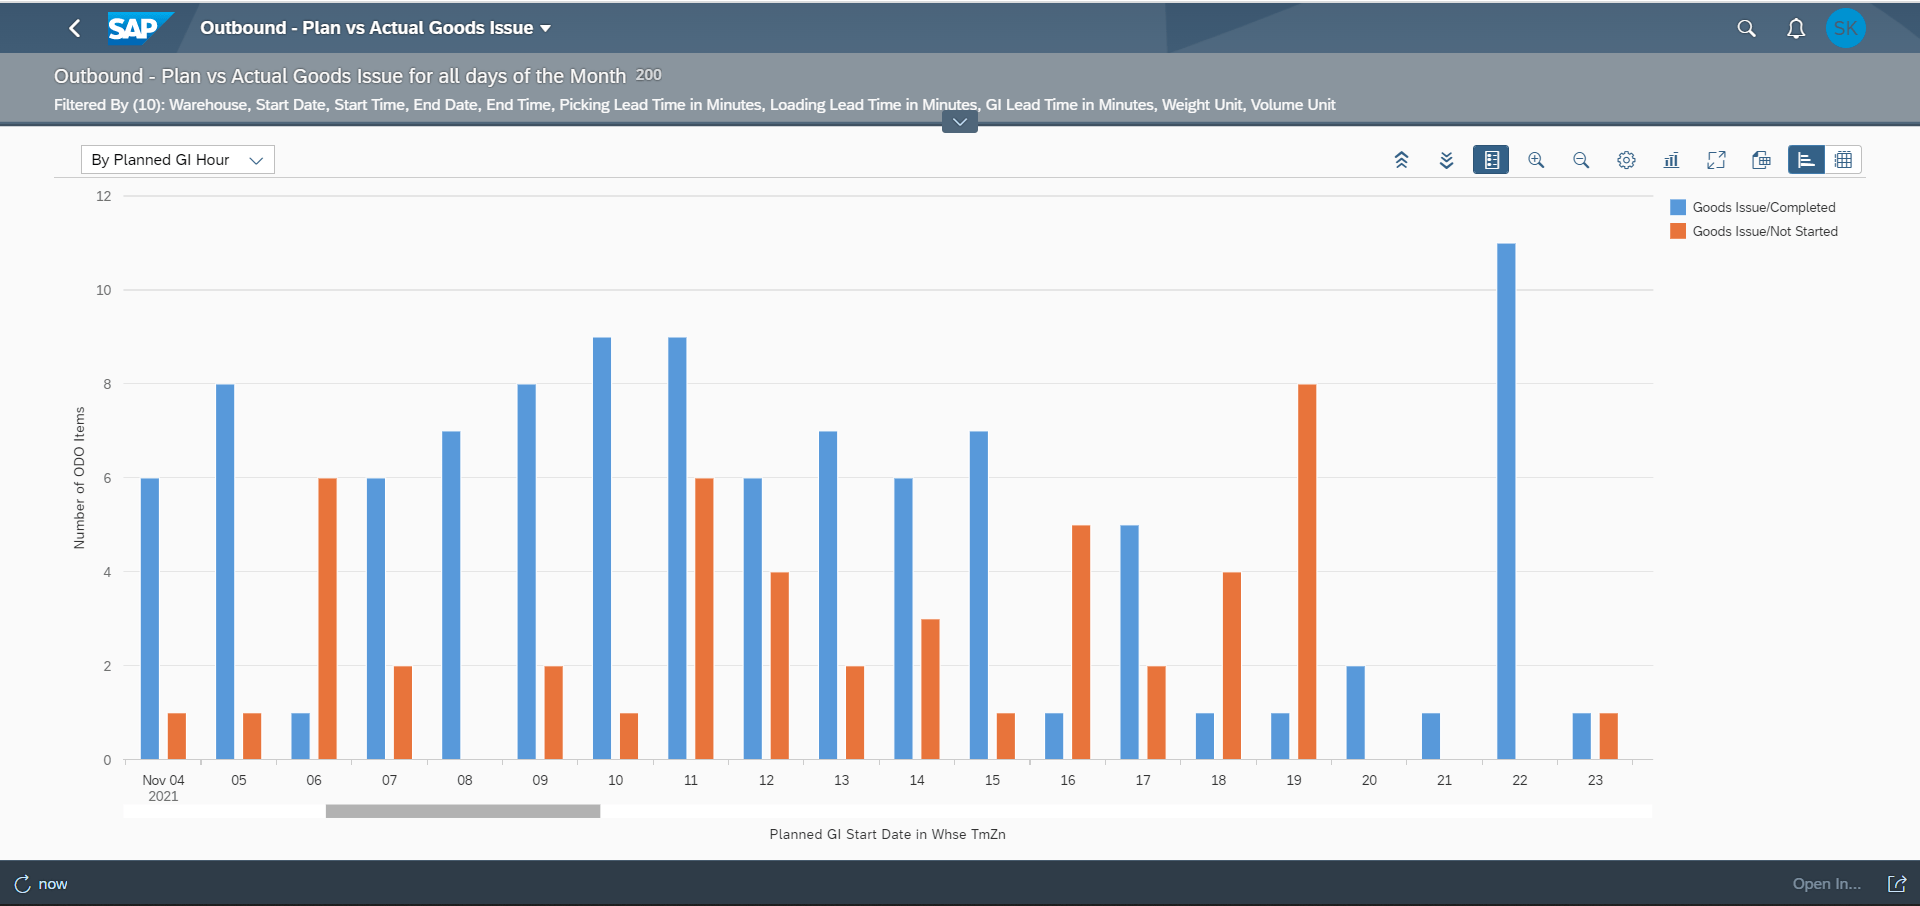
This shows how many deliveries were planned to be delivered to the customer and how many were delivered in reality.
Possible actions would be to plan resources based on outstanding orders and to track Warehouse execution performance in the order fulfilment process. Make sure you are using your resources effectively to complete as many deliveries as possible.
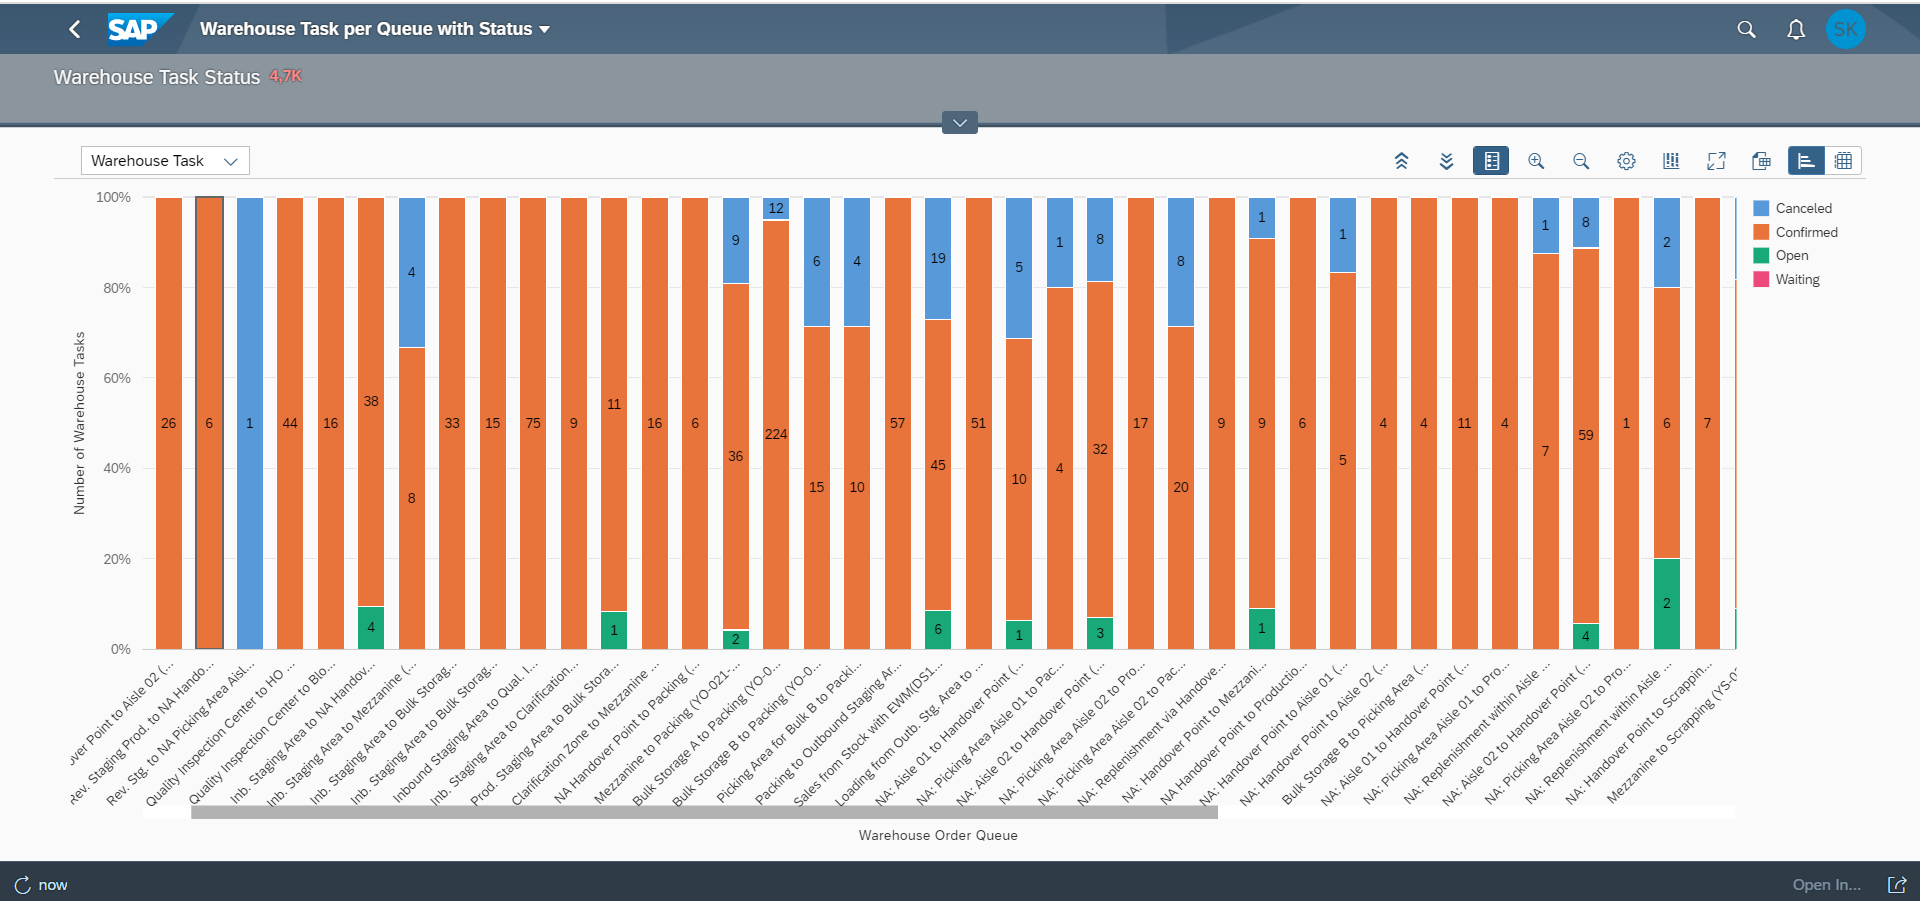
2: Track the status of warehouse tasks
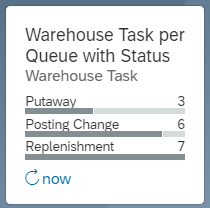
This analytical app gives us insight on the Warehouse Task and their status for different Queues. A Queue is a group of Warehouse Tasks based on Source Activity Area, Destination Activity Area, Bin Access type, or Process Type. Work is assigned and managed in Warehouse using Queues.
Using this app, we can see how many of the Warehouse Tasks are Confirmed, Open, Waiting and Cancelled for each Queue.
Track the percentage of work completion and get insight on the pending work in different areas of the warehouse. This app give you full visibility of task progress and completion.
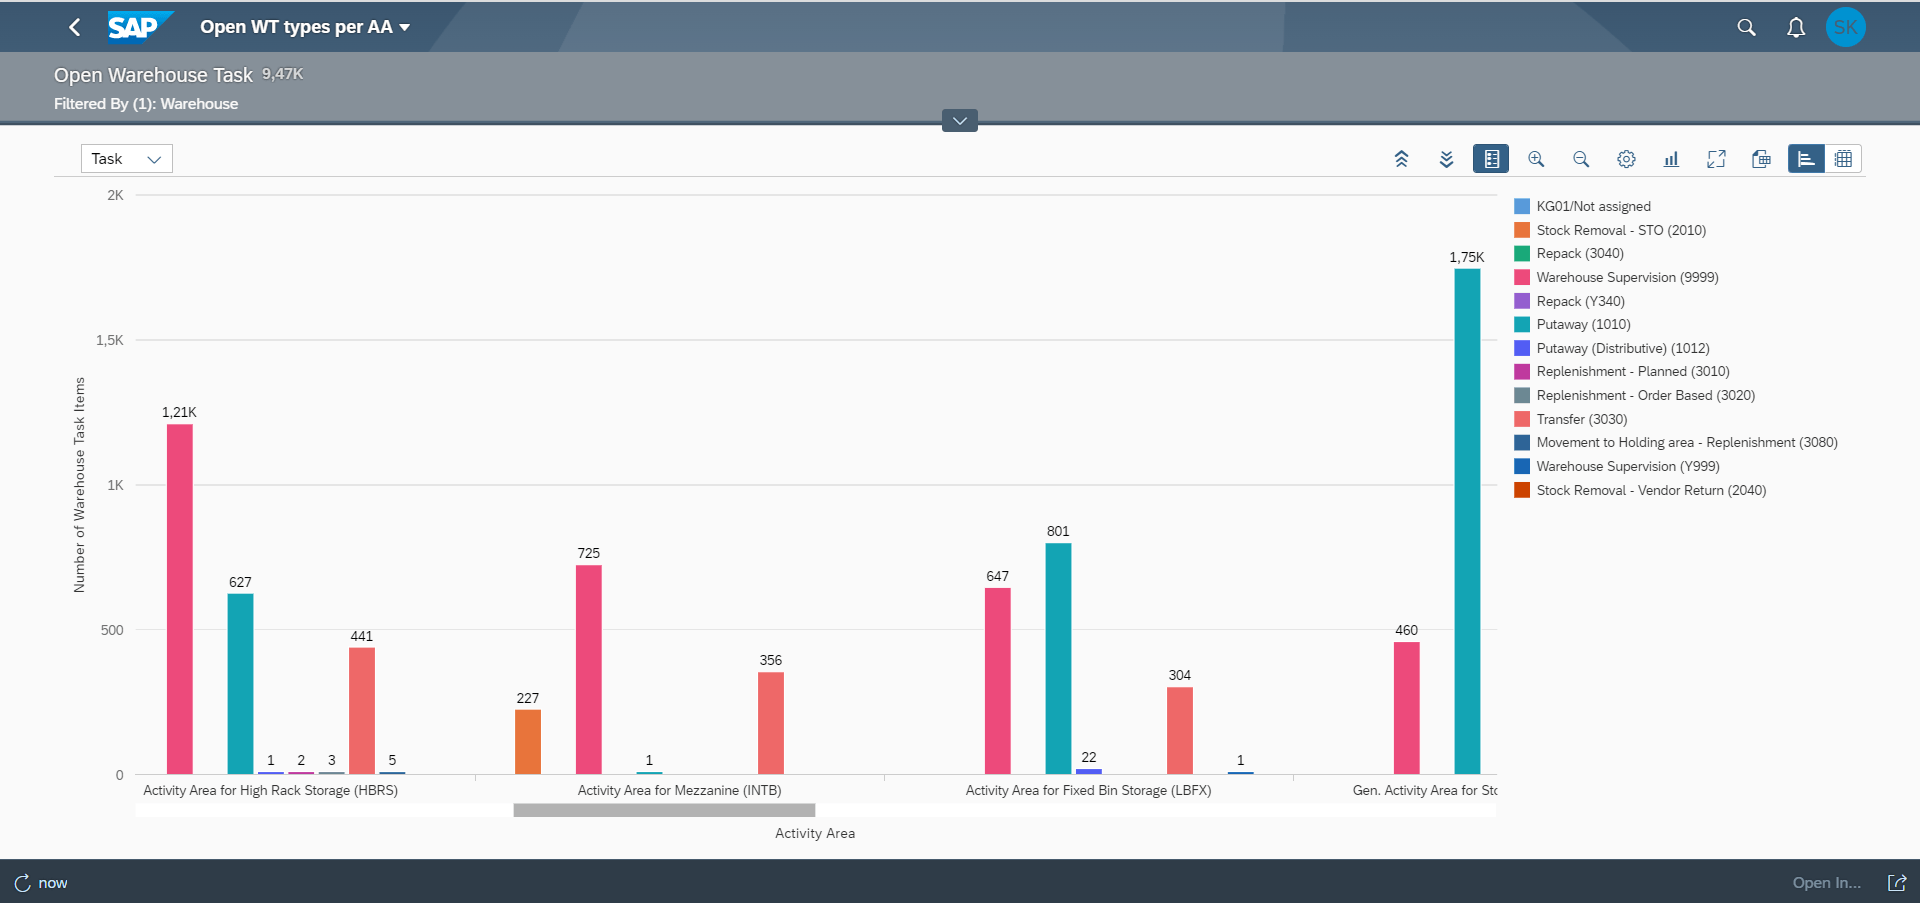
3: Open Warehouse Task Type per Activity Area
We can use this app to observe the number of Open Warehouse Tasks for each Warehouse Process Type in an activity area. It provides details on the amount of work needed to be done in each Activity Area for different Processes carried out in Warehouse.
Resources can be planned based on the open requests. This app will also assist Warehouse Supervisors to assign Resources to queues.
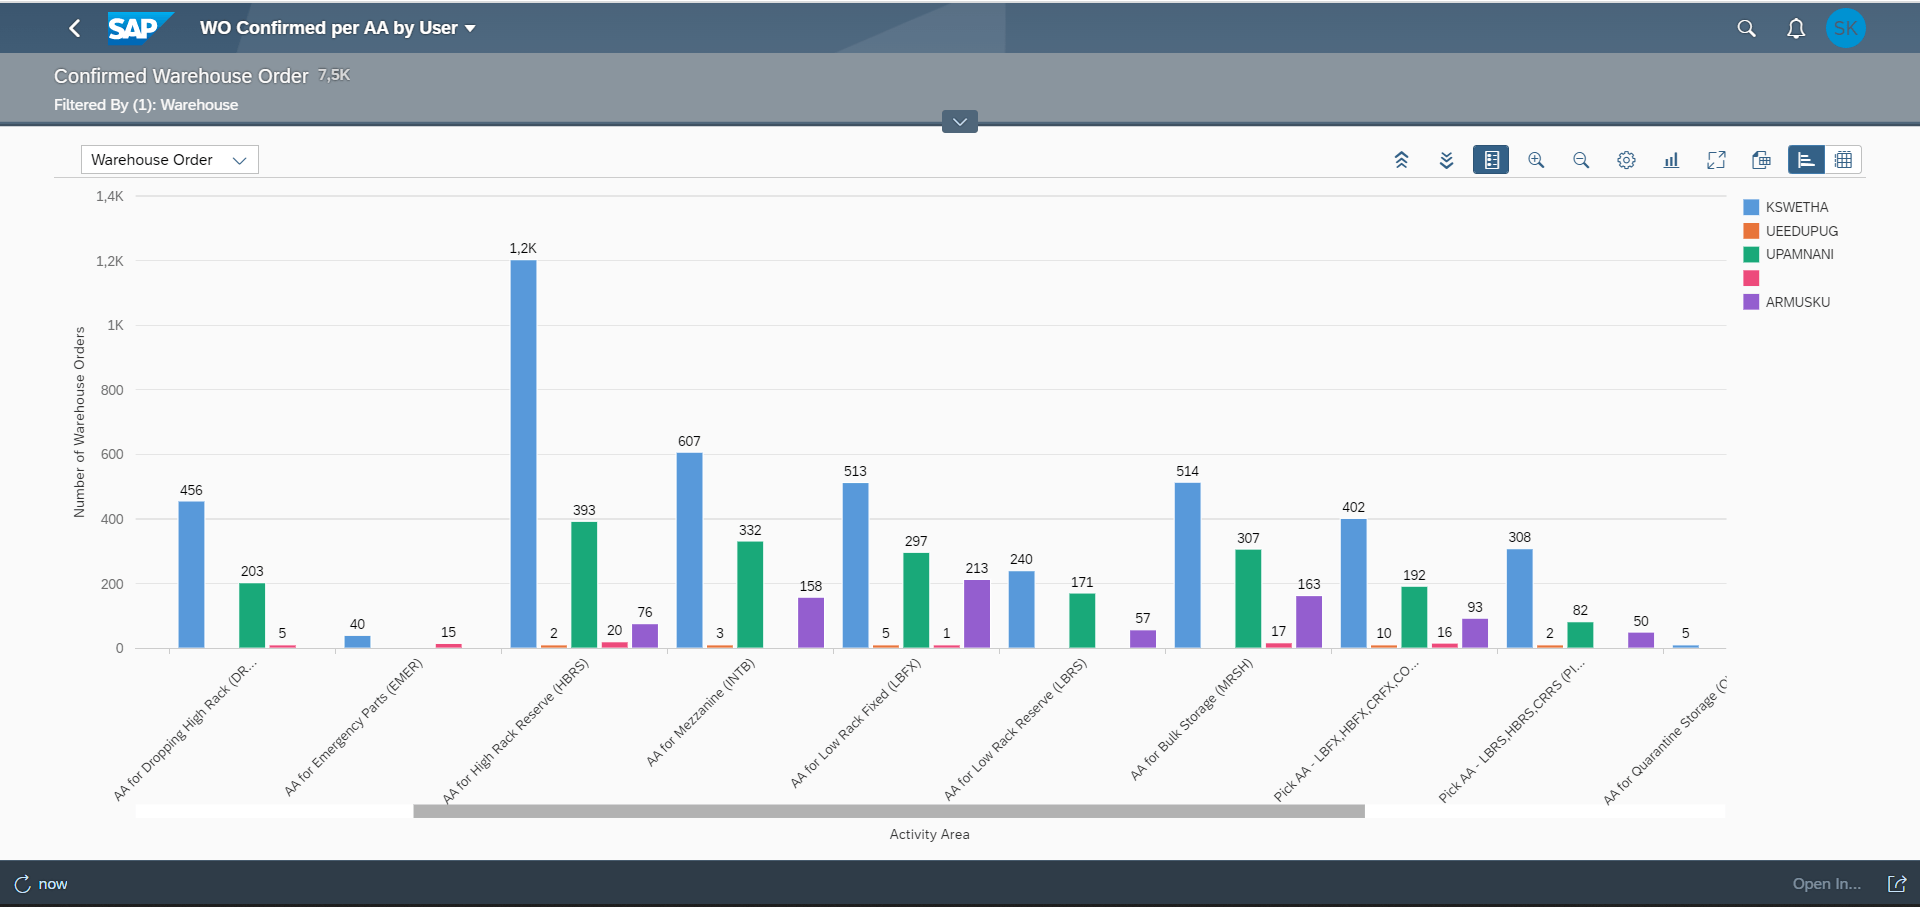
4: Warehouse Orders Confirmed per Activity Area by User
This analytical app gives us insight on Warehouse Orders from different users across Activity Areas.
We can use this app to check the amount of work done by a user in each Activity Area by confirming the Warehouse Orders.
This will help to track the utilisation of the Warehouse operative and build a complete picture of worker performance.
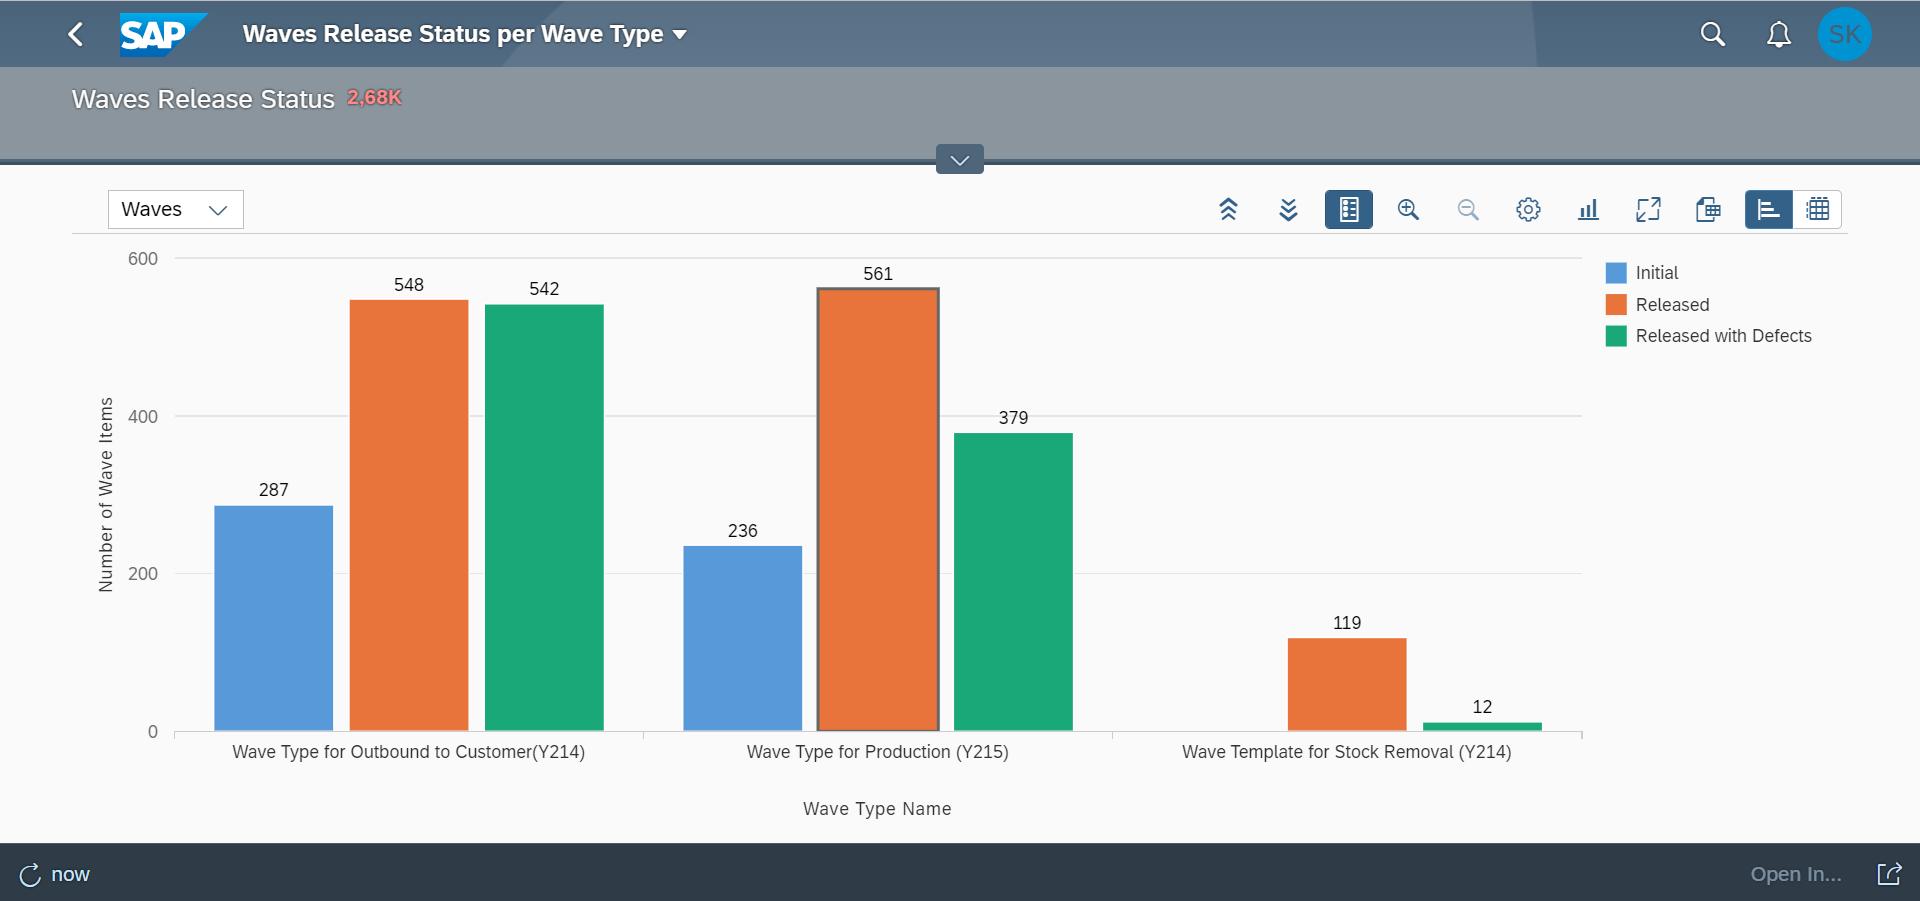
5: Waves Release Status per Wave Type
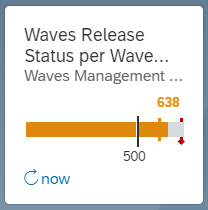
This analytical app gives insight on waves with status Initial, Released and Released with Defects for different Wave Types. This helps users to monitor the Wave failures on a daily basis and to track progress on the corrective actions taken to improve the stock situation in Warehouse.
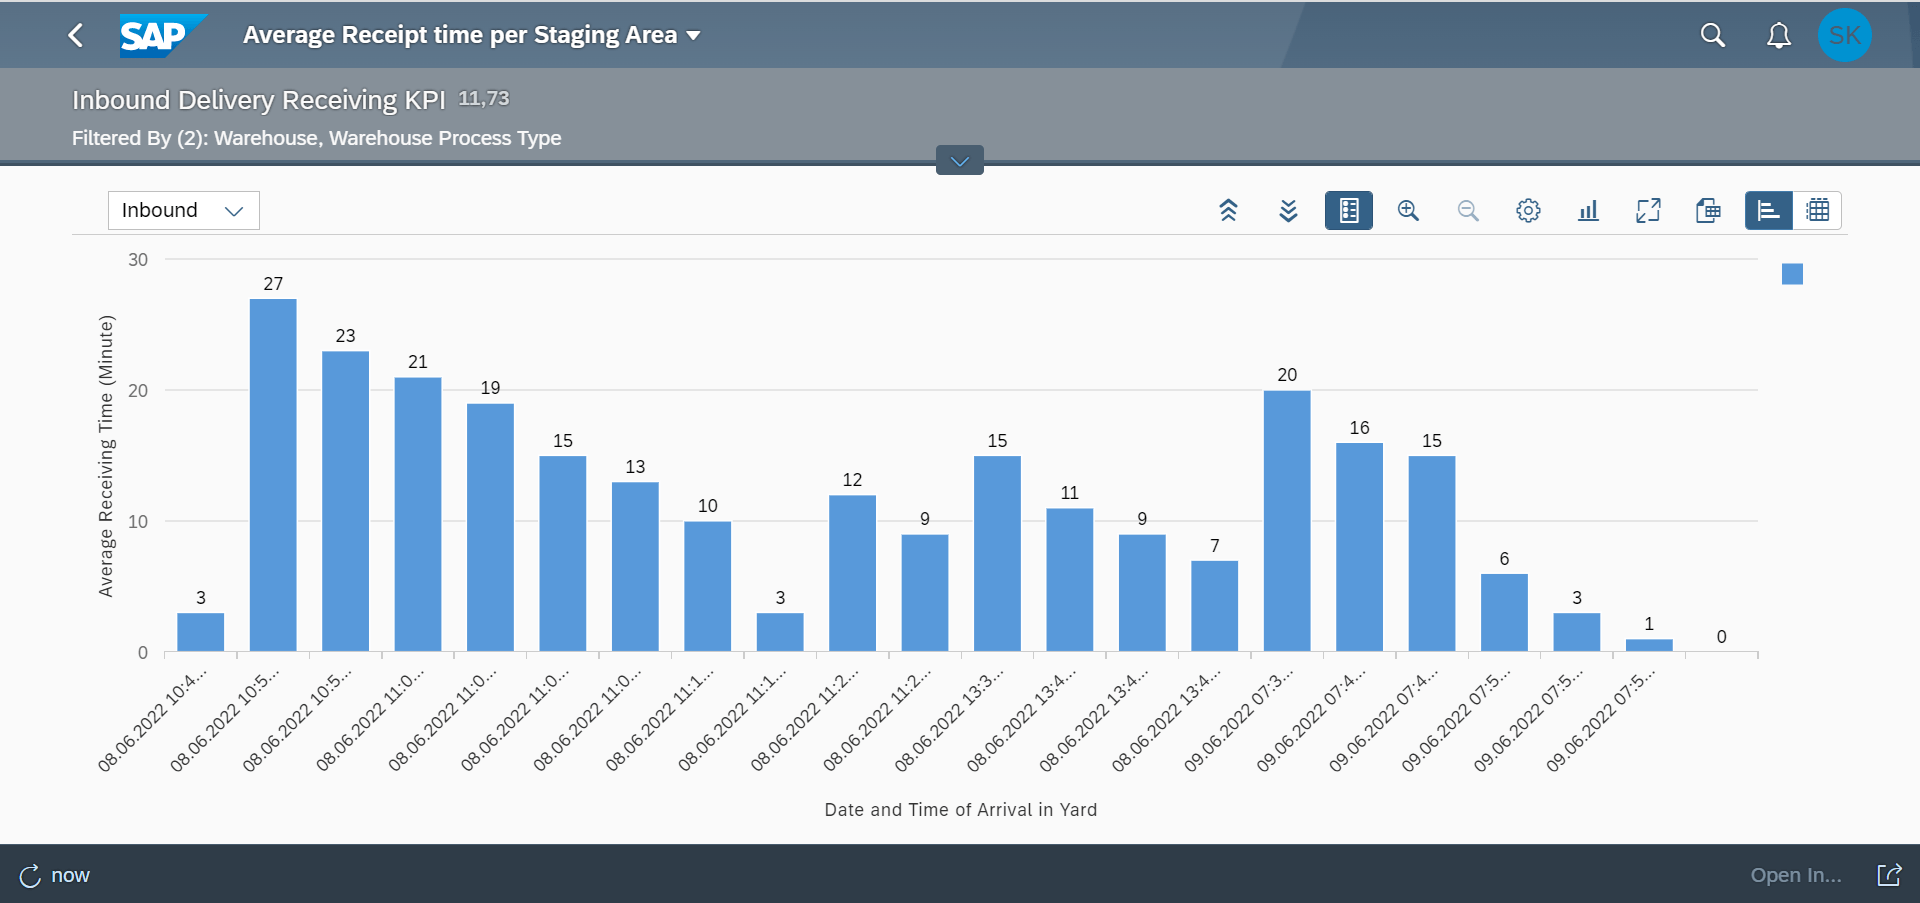
6: Average Receipt Time per Staging Area
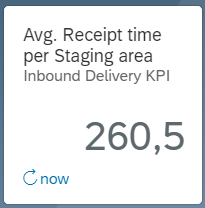
This analytical app gives insight on the time taken to complete Goods Receipt in Warehouse per Staging area. This Warehouse KPI is important to plan the number of users/resources required for Goods Receipt processing and to plan capacity of Doors and Staging area.
If the Stock is in staging area for long time, it may result in waiting time of trucks in the yard as the new stock could not be unloaded. It may also cause delays in the supply of urgent parts to production.
Using this app, we can track average time for stock in staging area against the KPI designed for the warehouse. If the performance is not within the limits, appropriate actions can be taken, for example adding an additional forklift for putaway, or providing a better solution for Goods Receipt.
Summary
Optimise your SAP EWM processes to make your business more efficient and adaptable. Real-time analytics can help you to utilise your resources most effectively, resulting in cost savings and customer satisfaction.
If you’d like to find out more about how to implement these analytics solutions, please get in touch at info@kagool.com.
Follow us on

Discover why experienced data migration consultants are essential to successful SAP implementations. Learn how expert guidance ensures clean, validated, and high-quality data that supports long-term business success.
Struggling with warehouse inefficiencies? Discover how Kagool's SAP EWM solutions streamline logistics, cut costs, and transform supply chain performance.